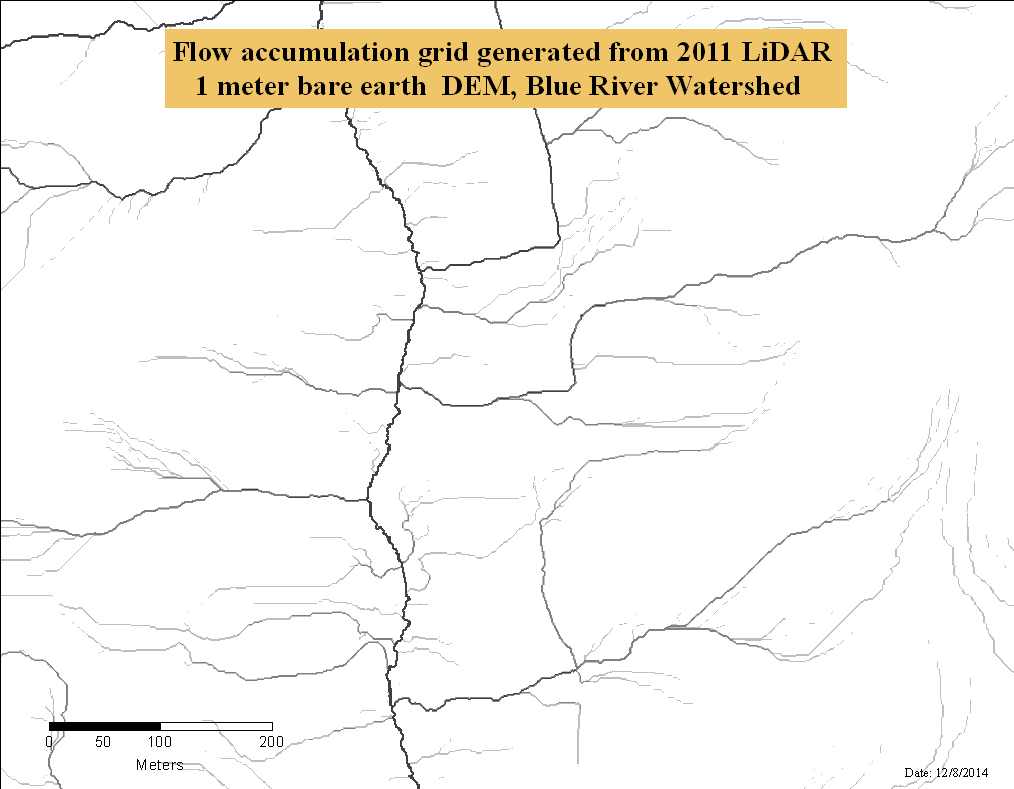
Flow accumulation grid generated from 2011 LiDAR 1 meter bare earth DEM, Blue River Watershed
Raster Dataset

Tags
USFS, Oregon, LiDAR, bare earth,
Linn County, digital terrain model, EPA, bare ground, Light Detection and Ranging, Pacific
Northwest, Blue River, elevation data, topography, high-resolution, DEM, Lane
County
This data provides a method to determine where water would flow within a 3D surface. The value of each point on the grid provides the sum of the cells that drain to that point. This data is used to derive watershed boundaries from source points, and to generate stream networks.
This dataset has been derived from the Blue River 1 meter LiDAR data. The values represnt the number of cells (1 meter by 1 meter) that drain to the cell. This data is used to derive stream and watershed layers. Output cells with a high flow accumulation are areas of concentrated flow and can be used to identify stream channels. Output cells with a flow accumulation of zero are local topographic highs and can be used to identify ridges.
This dataset represents the Blue River Watershed survey area in Linn and Lane County, OR. This bare earth digital elevation model (DEM) represent the earth's surface with all vegetation and human-made structures removed. The bare earth DEMs were derived from LiDAR data using TIN processing of the ground point returns. The DEM grid cell size is 1 meter. The elevation units are in meters. Some elevation values have been interpolated across areas in the ground model where there is no elevation data (e.g. over water, over dense vegetation). Watershed Sciences, Inc. collected the LiDAR and created this data set for the EPA and USFS.
There are no credits for this item.
In some areas of heavy vegetation or forest cover, there may be relatively few ground points in the LiDAR data. TINing the points produces large triangles and hence the elevations may be less accurate within such areas. Elevation values for open water surfaces are not valid elevation values because few LiDAR points are returned from water surfaces. Triangles were created across water surfaces by interpolating from the nearest land points.
Extent
West -122.334155 East -122.129467 North 44.340085 South 44.202966
Maximum (zoomed in) 1:5,000 Minimum (zoomed out) 1:150,000,000