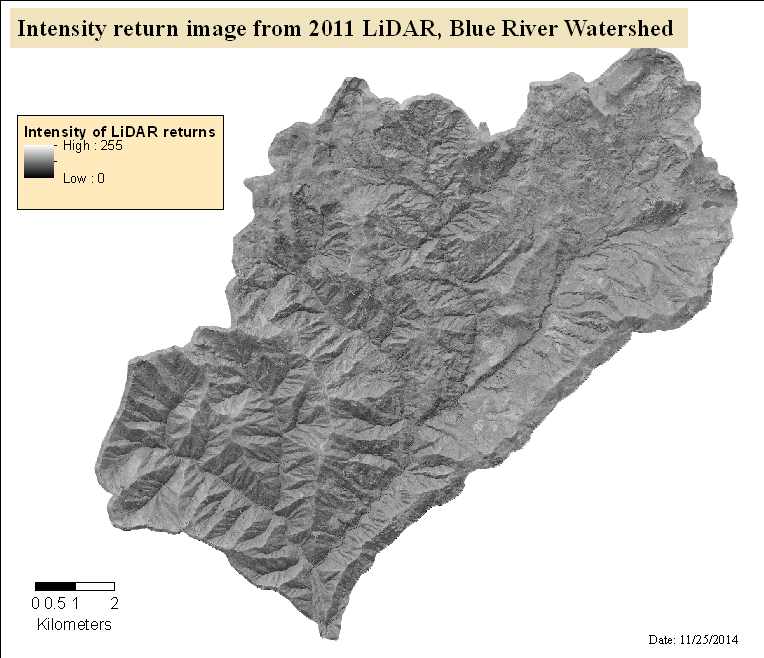
Intensity return image from 2011 LiDAR, Blue River Watershed
Raster Dataset

Tags
Light
Detection and Ranging, high-resolution, Blue River, Lane County, Oregon, intensity image,
Pacific Northwest, Normalized Intensity, Linn County, LiDAR
Provide intensity images.
This dataset represents the Blue River Watershed survey area in Linn and Lane County, OR. Each intensity image depicts, at a 0.5 meter resolution, normalized intensity values of the LiDAR laser returns. Watershed Sciences, Inc. collected the LiDAR and created this data set for the USDA Forest Service and the US Environmental Protection Agency.
Variability in the magnitude of intensity values across similar targets is a function of receiver auto gain control, laser power setting, atmospherics (transmissivity and target range), and angle of incidence. (Gain is a laser system setting that amplifies or dampens a return signal, resulting in artificially high or low intensity values.) These components influence intensity at different rates and magnitudes, with auto gain comprising the majority of influence. Variability in each of these components is minimized mathematically to arrive at a normalized intensity value that approaches a true radiometric value for each discrete LiDAR return. WSI employs proprietary software to normalize intensity values, based on assessment of the components discussed above, to a reference gain value for each laser employed in a LiDAR survey.
There are no credits for this item.
There are no access and use limitations for this item.
Extent
West -122.334155 East -122.129467 North 44.340085 South 44.202966
Maximum (zoomed in) 1:5,000 Minimum (zoomed out) 1:150,000,000